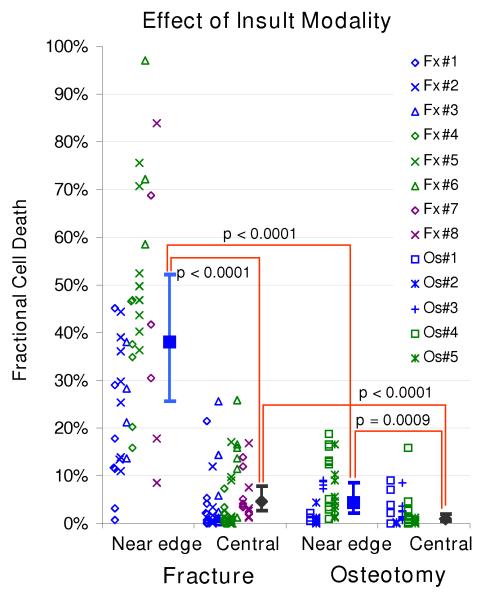
Figure 5.
Chondrocyte viability in the superficial zone, at 48 hours after impaction fracture vs. osteotomy, in near-edge regions (typically up to 0.3-0.4 mm away from a fracture/osteotomy line) and in central (control) regions. The scatter plots indicate fractional cell death for each specimen/site combination, from the eight impaction-fractured (Fx) and five osteotomized (Os) specimens. The filled squares/diamonds and dispersion bars indicate (estimated) means calculated in the logistic regression analysis, and 95% confidential intervals, respectively.

