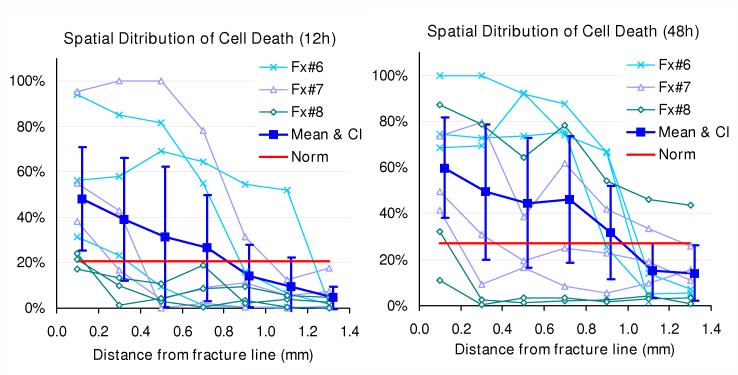
Figure 7.
patial distribution of fractional cell death in the superficial zone, at 12 or 48 hours post-fracture. The filled squares and dispersion bars indicate the mean values and 95% confidential intervals of fractional cell death measured separately for seven 0.2 mm-wide zones. Data from each specimen/site combination are also individually plotted. The red solid lines indicate the upper limit of normative range (mean plus two standard deviations) of fractional death in central regions, at each observation time.

