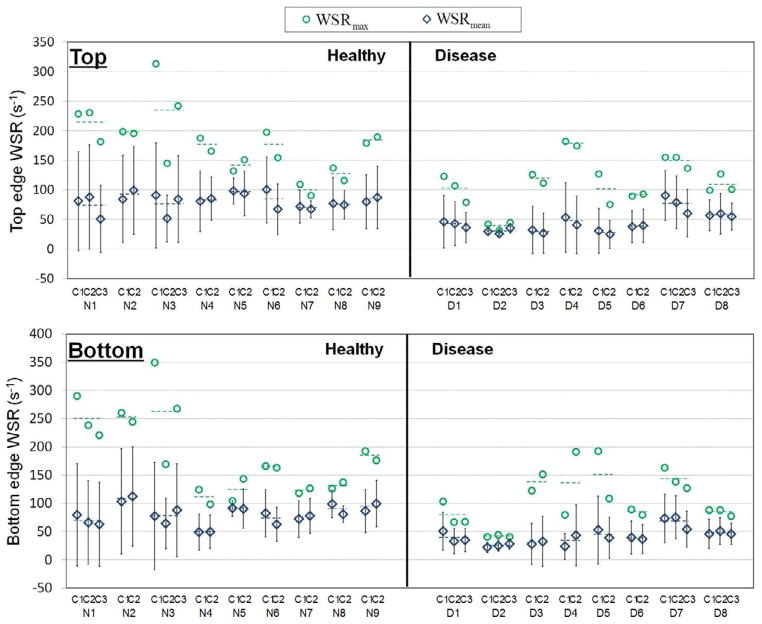
Fig. 4.
Mean vascular wall shear rate (WSRmean) and maximum vascular wall shear rate (WSRmax) in each cardiac cycle during physiologic pressure for nine healthy and eight renal disease (six CKD and two ESRD) subjects from top and bottom vascular wall edges. (N1 to N9 representing healthy subjects, D1 to D6 representing CKD subjects, D7 and D8 representing ESRD subjects and C1, C2 and C3 representing cardiac cycles and dotted line representing mean values)

