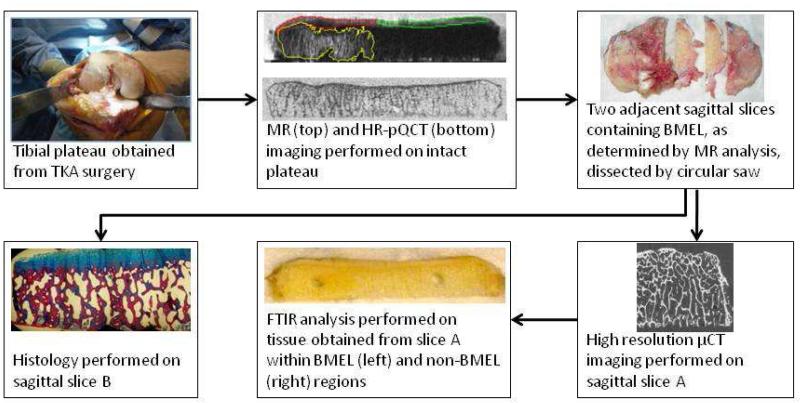
Figure 1.
Schematic of study workflow. The tibial plateau is obtained during surgery and scanned via MR and HR-pQCT. A contour delineating the BMEL region is defined on T2-weighted FSE images and transformed to the HR-pQCT coordinate system following spatial registration of the two data sets. Cartilage overlying BMEL (red) is differentiated from surrounding cartilage (green) and overlaid onto the reconstructed T1ρ and T2 maps for cartilage parameter calculation. Adjacent slices containing BMEL are dissected from the specimen and processed for μCT imaging and FTIR spectroscopy (slice A) and histology (slice B).

