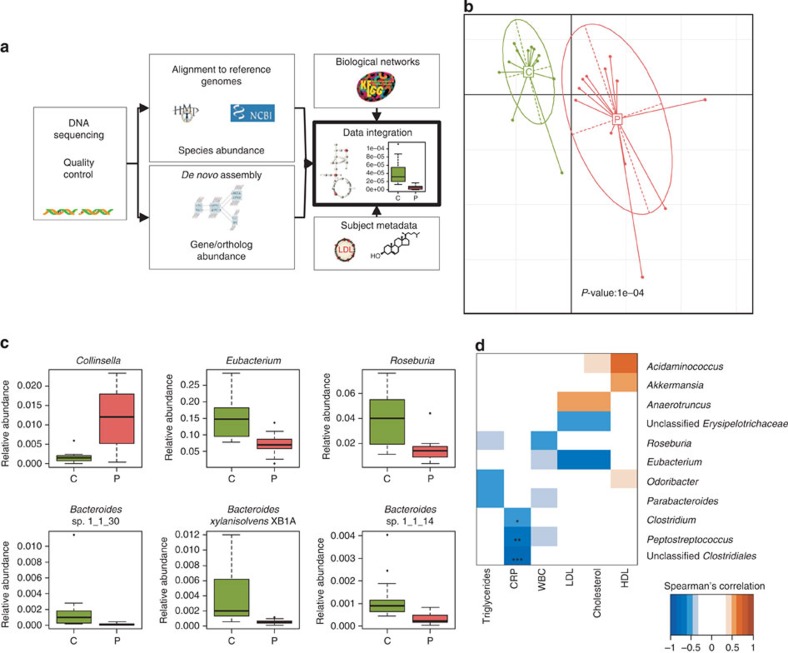
Figure 1. Microbial composition associated with symptomatic atherosclerosis.
(a) Illustration of our bioinformatics pipeline for analysing metagenome data to elucidate its relation to human metabolic disease. Sequence reads from the gut metagenome were generated with high-throughput sequencing technology and subjected to quality control. High-quality reads were used for alignment to reference genomes to estimate species abundance. De novo assembly of the metagenome allows for discovery of new genes not yet found in databases. Annotation of genes to KEGG allows for integration of information at the gene level with the metabolic network. Data on plasma metabolites and proteins together with gut metagenomic data constitute a basis for discovery of mechanisms for gut metagenome association with etiology of complex diseases. (b) Principal component analysis of microbial species abundance using health status as instrumental variable. Red is patients (P, n=12), green controls (C, n=13). The relation between microbial abundance and health status was assessed with Monte Carlo simulations with 10,000 replications by which a P-value was calculated. (c) Abundance of bacterial genera and species that differ between patients (n=12) with symptomatic atherosclerosis (P) and controls (n=13) (C). Adj. P<0.05 for all. (d) Bacterial genera correlating with biomarkers of atherosclerosis, using Spearman’s correlation. All samples, including the two excluded controls (see methods for details), were used for correlations with triglycerides, CRP (n=27, respectively) and white blood cell count (WBC; n=23). Only controls were used for low-density lipoprotein (LDL), high-density lipoprotein (HDL) and cholesterol correlations to avoid interactions with possible drug effects (n=15). *Adj. P<0.05, **adj. P<0.01 and ***adj. P<0.001. Boxes denote the interquartile range (IQR) between the first and third quartiles and the line within denotes the median; whiskers denote the lowest and highest values within 1.5 times IQR from the first and third quartiles, respectively. Circles denote data points beyond the whiskers.

