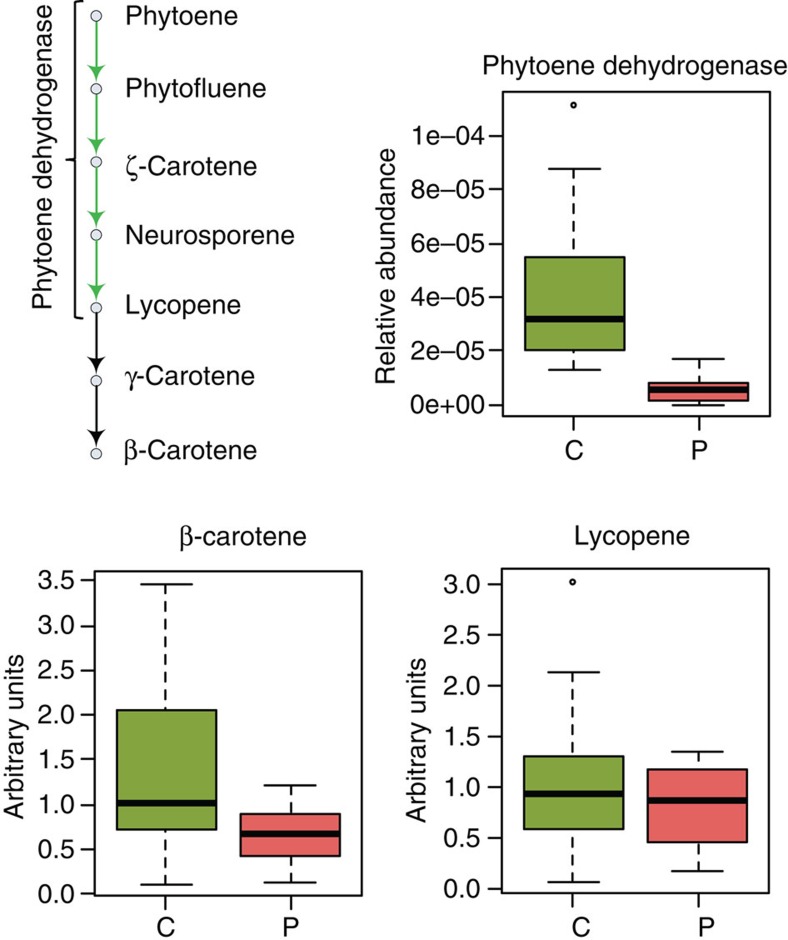
Figure 4. Phytoene dehydrogenase K10027 is enriched in the gut metagenome of healthy controls.
β-Carotene (P=0.05, Student’s t-test) but not lycopene (P=0.35, Student’s t-test) was enriched in serum of healthy controls. Red is patients (P), green controls (C). Boxes denote the interquartile range (IQR) between the first and third quartiles and the line within denotes the median; whiskers denote the lowest and highest values within 1.5 times IQR from the first and third quartiles, respectively. Circles denote data points beyond the whiskers.

