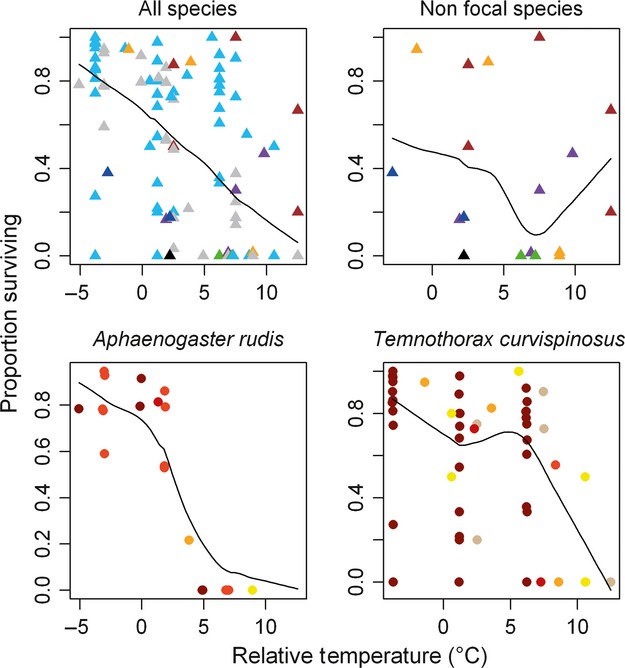
Figure 1.

Scatterplots of survival (at final census) as a function of mean rearing temperature – source-location summer temperatures. Upper left panel shows data for all species considered in the experiment; upper right shows all species except for Aphaenogaster rudis and Temnothorax curvispinosus; lower left shows A. rudis; and lower right shows T. curvispinosus survival. Positive x-axis values indicate cases when experimental temperatures were higher than those at colony source locations, and negative values indicate cases when rearing temperatures were lower. Lines represent locally weighted scatterplot smoothing (function loess in R). In plots with multiple species (upper panels), species are shown in different colors: green, Aphaenogaster carolinenesis; blue A. fulva; gray, A. rudis; black, Camponotus chromaiodes; purple, Crematogaster lineolata; orange, Tapinoma sessile; light blue, Temnothorax curvispinosus; brown, Temnothorax longispinosus. For A. rudis and T. curvispinosus (bottom panels), colors represent mean summer temperatures at source locations: A. rudis – dark red, 26.1°C; red, 24.8°C; orange-red, 24.1°C; orange, 22.3°C; yellow, 22.1°C; tan, 18.5°C; T. curvispinosus – dark red, 24.8°C; red, 23.7°C; orange-red, 22.6°C; orange, 22.4°C; yellow, 20.4°C; tan, 18.5°C.
