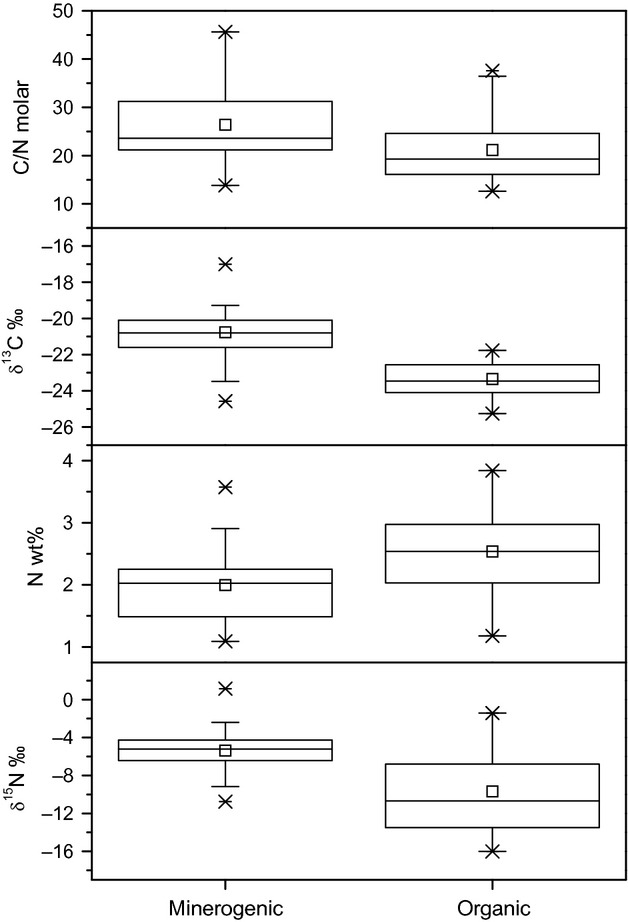
Figure 3.

Box-and-whisker plot comparing isotopic compositions, N content, and C/N ratios of Xanthoria parietina grown on minerogenic and organic substrate. Whiskers represent the lowest and highest dates within the 1.5 interquartile ranges. Crosses are 1st and 99th percentiles, respectively, and short lines the most extreme values. Means are given by open squares.
