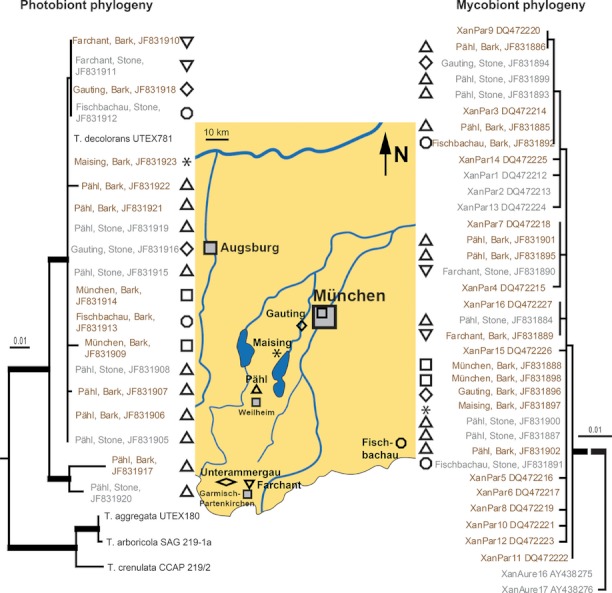
Figure 4.

Molecular analysis of the nrITS region of selected specimens of Xanthoria parietina. Shown are the single most likely trees of a ML search regarding the nrITS sequences of the photobionts (left-hand side) and mycobionts (right-hand side), respectively, analyzed together with selected sequences from Genbank. A MP search resulted in one tree each with identical tree topology. Branches with high statistical support (≥95% bootstrap support for MP and ≥75% bootstrap support for ML) are indicated by thick lines. For the mycobionts, the line connecting the X. parietina sequences has been shortened due to practical reasons, which is indicated by the dashed line. For the photobionts, the distance to the sequences used as outgroup (see Materials and Methods section for details) is not shown. Specimens growing on bark are given in brown color; gray color is used for the specimens from rocks. In the center, a map of southern Bavaria indicates the geographic location of the sampling localities characterized by the respective symbols. Grey filled symbols represent major cities.
