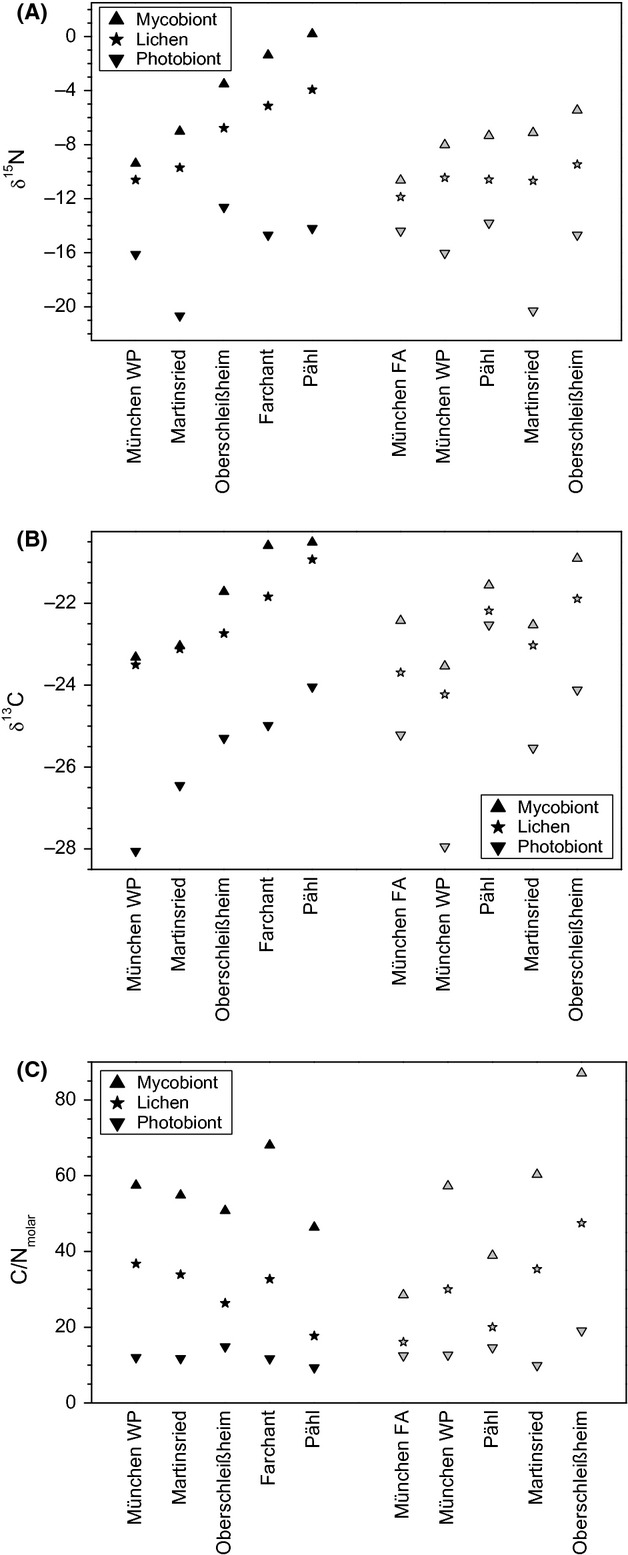
Figure 5.

Nitrogen (A) and carbon (B) isotopic composition as well as C/N ratios (C) of 10 Xanthoria parietina populations and of myco- and photobionts separated from the same samples. Black symbols represent values from lichens that grew on minerogenic, gray symbols those that grew on organic substrates.
