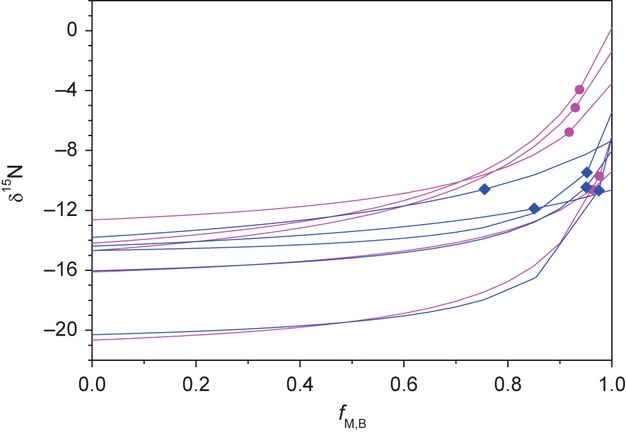
Figure 7.

Modelled δ15N values of the lichens from Figure 5A with increasing fraction of mycobiont biomass (fM,B) based on a concentration-dependent two-end-member mixing model. End points of mixing lines represent δ15N values of photo- and mycobionts, respectively. The actually measured δ15N values of lichens are given as diamonds on the respective mixing lines (symbols as in Fig. 5A). Colors differentiate lichens grown on minerogenic (magenta dots) and organic (blue diamonds) substrate.
