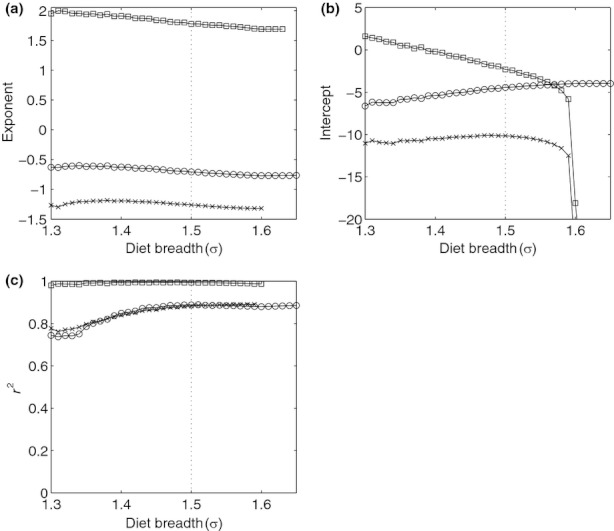
Figure 2.

Effect of varying the diet breadth σ on the fitted linear regressions (circles – density-mass allometry (1); crosses – variance-mass allometry (2); squares – Taylor's law (3)): (a) exponents a1, b1, and c1; (b) intercepts a0, b0, and c0; (c) r2. All other parameter values were as in Table 1. Dashed vertical line shows the value of σ = 1.5 corresponding to the results shown in Figure 1.
