
Figure 5.
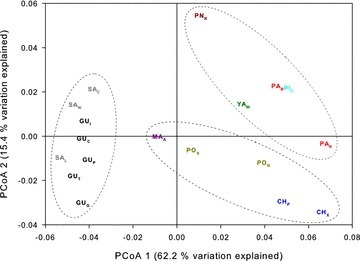
Principal coordinate analysis of all pairwise FST comparisons between the 18 sites sampled in the western Pacific. Both axes combined explain 77.6% of the total variation. See Table 1 for site codes. Samples are color coded by island. Dashed rings denote population clusters detected by Bayesian analyses.