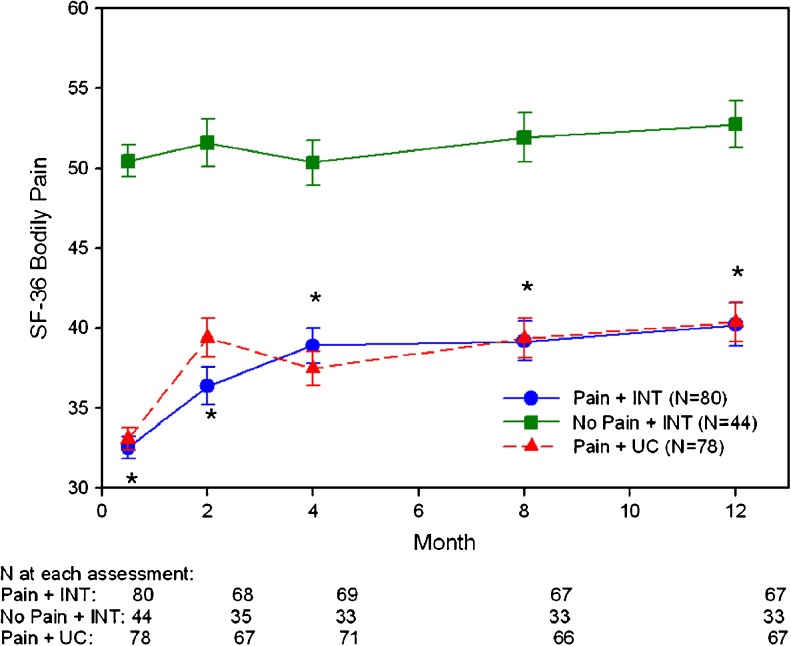
Figure 1.
Mean pain scores on the SF-36 Bodily Pain scale over 12 months. *Intervention patients with pain vs. intervention patients without pain, P < .0001. Bars indicate standard error. Higher scores indicate less pain. Controls for age, gender, race, marital status, working status, baseline PHQ-9 score, and comorbid conditions.

