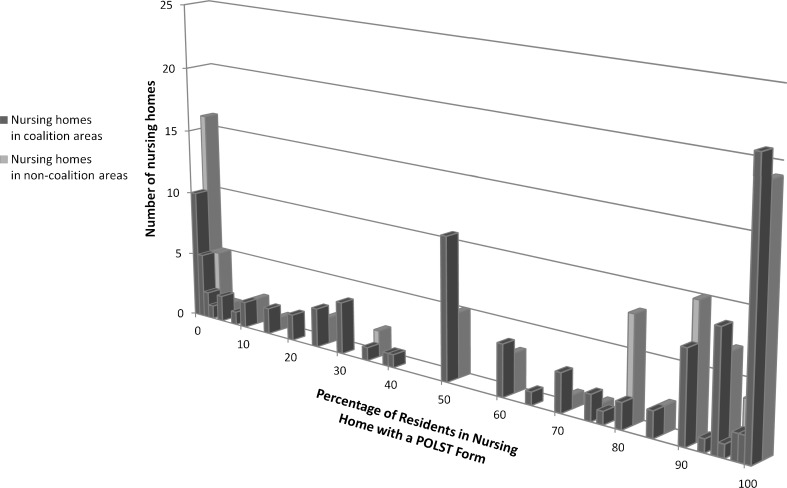
Figure 1.

Histogram of nursing home residents that have a POLST form, comparing nursing homes in coalition and non-coalition areas. This Figure shows the percentage of residents in each nursing home that have a completed POLST form, and compares nursing homes in coalition and non-coalition areas, 2010.
