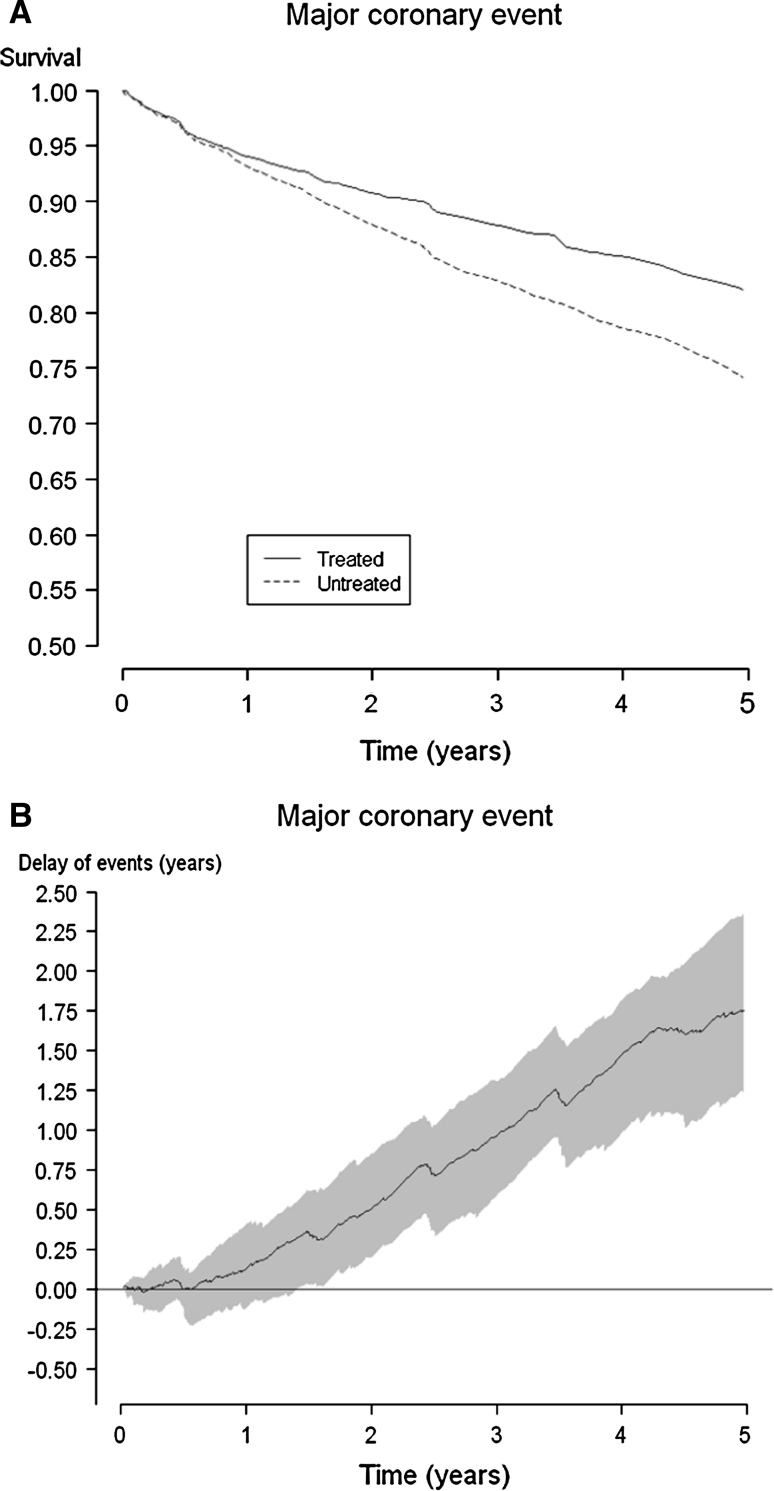
Fig. 3.
Kaplan-Meier curves for major coronary events* in the 4S study (a) and the consecutive delay of event curve with shadowed 95 % confidence interval (b). *Major coronary events comprised coronary deaths, definite or probable hospital-verified non-fatal acute MI, resuscitated cardiac arrest, and definite silent MI verified by electrocardiogram

