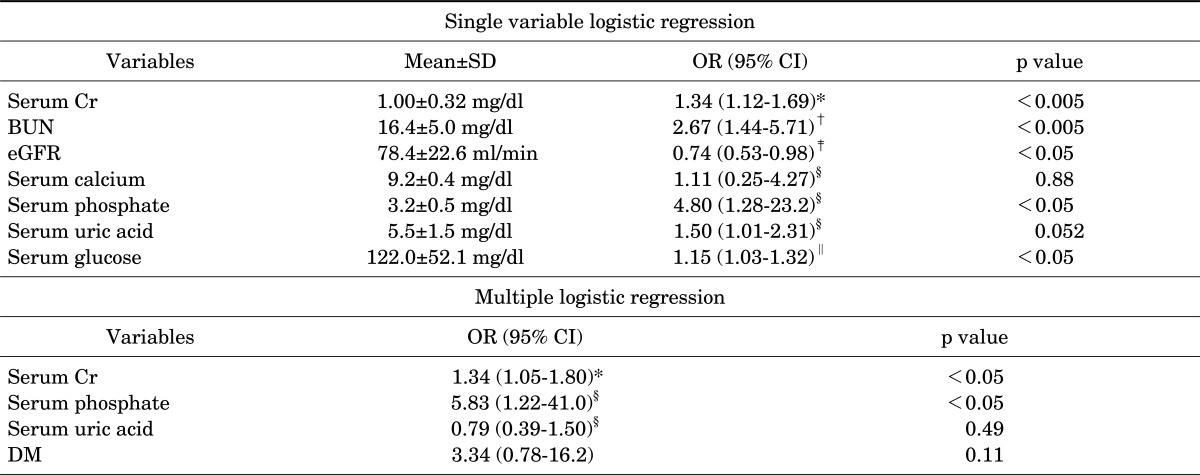
TABLE 2.
Single variable and multiple logistic regression analysis ofovert proteinuria. Data are gathered from patients who underwent medical examination and for whom there were urinary protein and creatinine ratio data
*For every 0.1 mg/dl serum Cr increment, †For every 5 mg/dl BUN increment, ‡For every 10 mg/min eGFR increment, §For every 1 mg/dl increment, ∥For every 10 mg/dl increment. SD: standard deviation, OR: odds ratio, Cr: creatinine, BUN: blood urea nitrogen, eGFR: estimated glomerular filtration rate.

