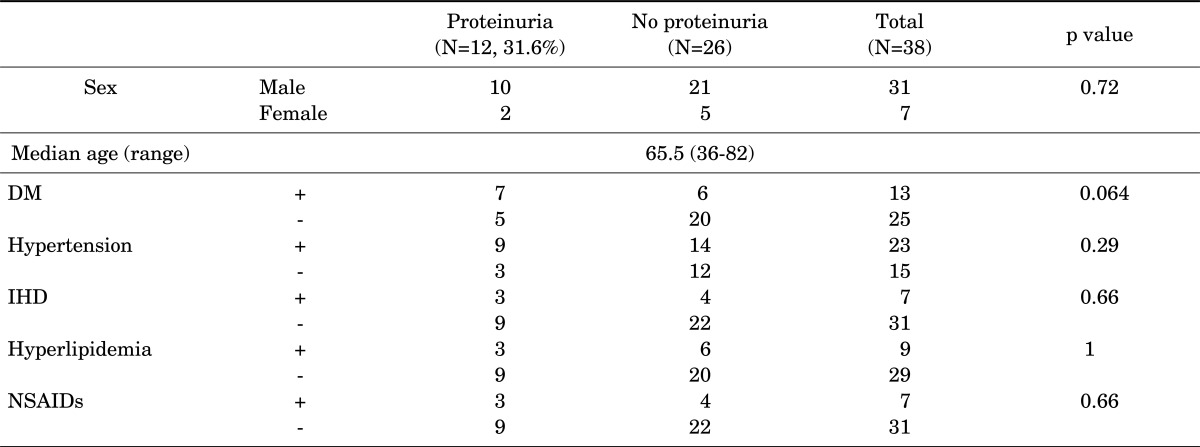
TABLE 3.
Demographic and clinical data. Data are from patients who underwent medical examination and for whom there were random urinary microalbumin and creatinine ratio data. They are divided into two groups according to the presence or absence of proteinuria (overt proteinuria and/or microalbuminuria)
p values are the result of chi-squared test or Fisher's exact test for the proportion of proteinuria in each variable. DM: diabetes mellitus, IHD: ischemic heart disease, NSAIDs: nonsteroidal anti-inflammatory drugs.

