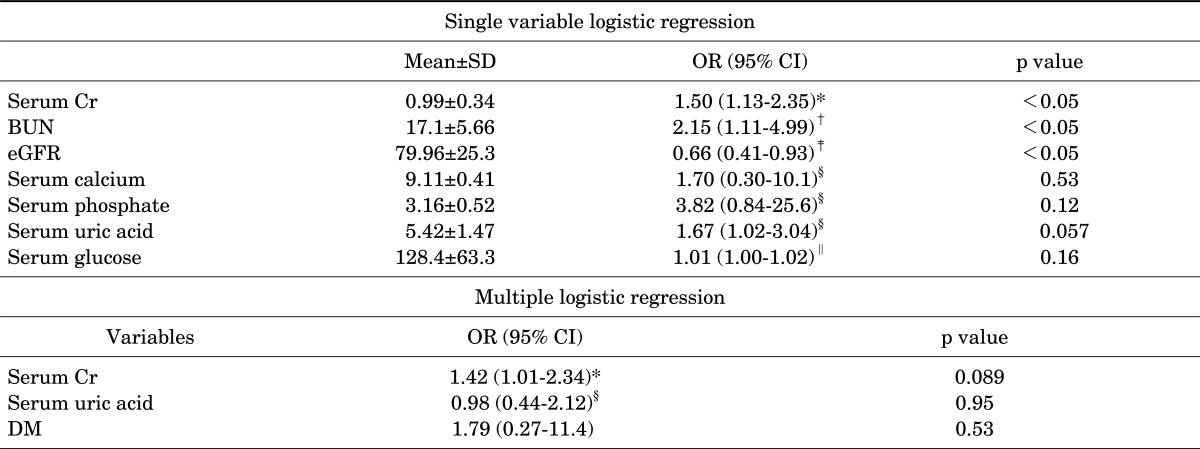
TABLE 4.
Single variable and multiple logistic regression analysis for proteinuria (overt proteinuria and/or microalbuminuria). Data are from patients who underwent medical examination and for whom there were urinary protein protein and creatinine ratio data
*For every 0.1 mg/dl increment, †For every 5 mg/dl increment, ‡For every 10 mg/min increment, §For every 1 mg/dl increment, ∥For every 10 mg/dl increment. SD: standard deviation, OR: odds ratio, Cr: creatinine, BUN: blood urea nitrogen, eGFR: estimated glomerular filtration rate.

