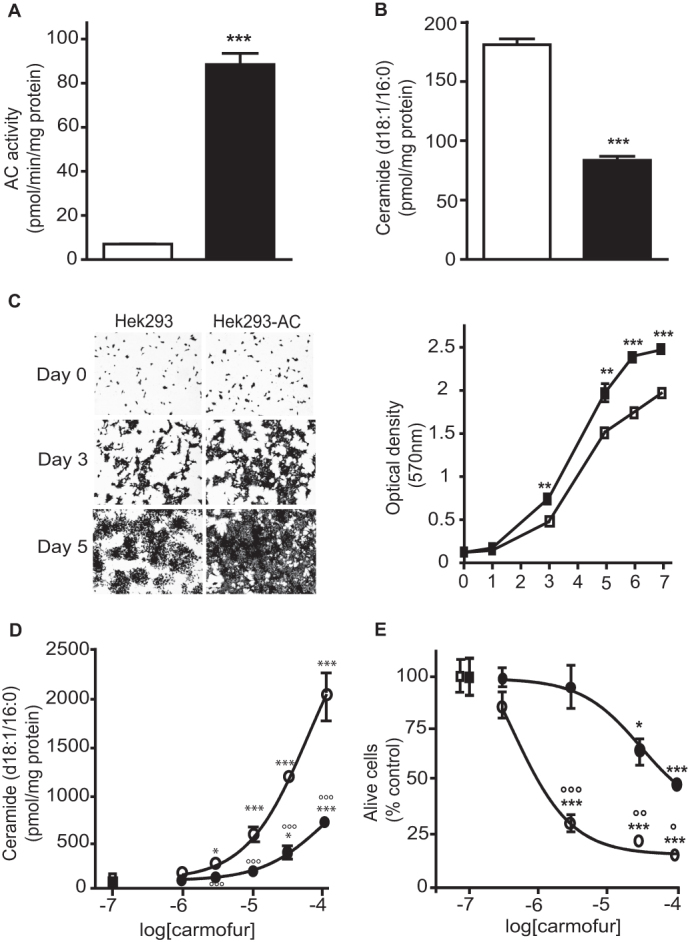
Figure 4. AC overexpression in HEK 293 cells confers resistance to carmofur.

(A) AC activity and (B) ceramide (d18:1/16:0) levels in native HEK 293 cells (open bars) or AC-over-expressing HEK 293 cells (closed bars).(C) Representative images and quantification of cell proliferation assessed by Crystal violet staining. Concentration-dependent effects of carmofur on (D) ceramide (d18:1/16:0) levels and (E) cell viability evaluated by Trypan blue exclusion [ untreated HEK 293,
  HEK 293 treated with carmofur (3 µM),
  untreated HEK 293-AC,
  HEK 293-AC treated with carmofur (3 µM)]. Results are expressed as mean ± s.e.m. (n = 4). *p<0.05, **p<0.01, ***p<0.001 vs vehicle, °p<0.05, °°p<0.001, °°°p<0.001 vs carmofur on HEK 293. Student's t test or two-way ANOVA followed by Tukey's test.
