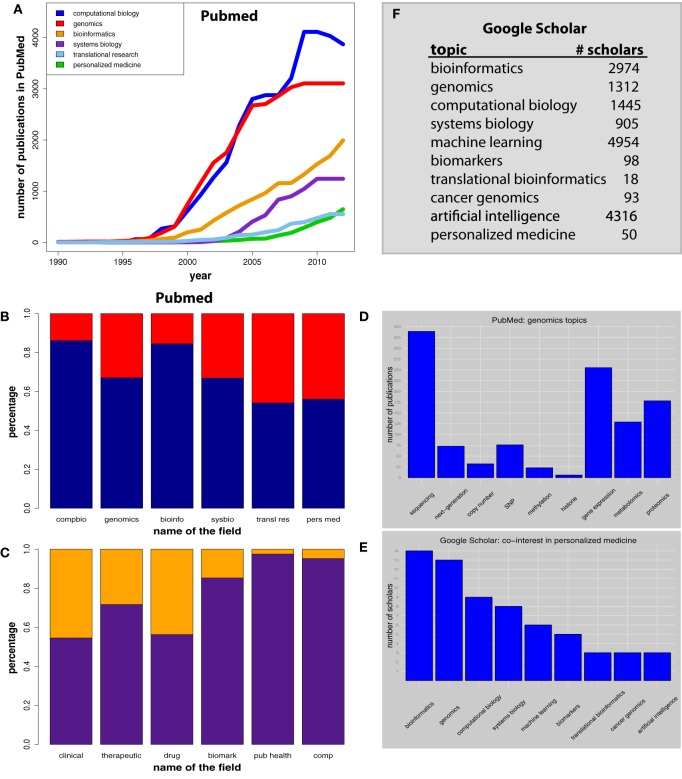
Figure 1.
(A) Number of PubMed publications. (B) Distribution of publications of the two categories “research paper” (blue) and “non-research paper” (red). (C) Distribution for conjugated searches. Orange corresponds to publications containing the search terms “personalized medicine” and “topic” (on the x-axis) and purple corresponds to all remaining publications. (D) Distribution of genomics data types, shown on the x-axis. (E) People interested in personalized medicine are also interested in the topics on the x-axis. (F) Numbers of scholar interested in the listed topics.

