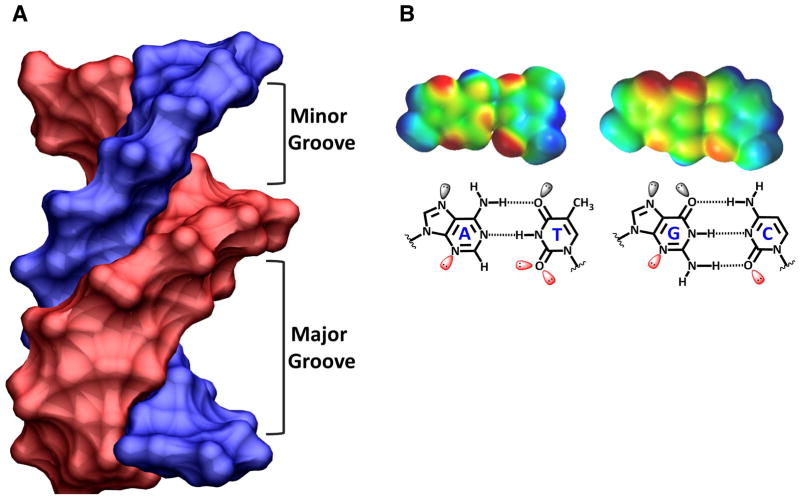
Figure 2.
(A) A B-form DNA model with the chains colored blue and pink is tilted so that the width of both the minor and major grooves can be seen and compared. (B) Space-filling models of AT and GC base pairs (top) is shown with electrostatic potential coloring: from blue for positive to red for negative partial charges. The same base pairs are shown as line models (bottom) with the base pairs labeled and lone pair electrons shown on H-bond accepting groups.

