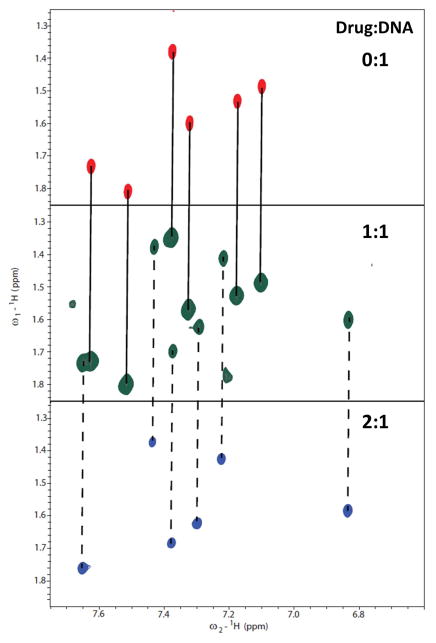
Figure 8.
Two-dimensional COSY spectra of the -ATGA- sequence and with DB293 complex showing the T-CH3 and T-H6 correlations at different ratios of DB293. The DNA sequence contains six thymine residues and all the six methyl-aromatic proton scalar couplings are observed in the absence of DB293 (0:1, top). At the intermediate ratio (1:1, middle), a doubling in the number of signals is observed suggesting the presence of two distinct species. One set of these peaks correspond to the free DNA (indicated with solid lines between 0:1 and 1:1). The other set of peaks correspond to the 2:1 complex based on the spectra at 2:1 ratio (bottom, indicated with broken lines between 1:1 and 2:1). The absence of any free DNA cross peaks at 2:1 highly suggests the complete saturation of free DNA at 2 molar equivalents of DB293. The presence of two distinct sets of signals at the intermediate ratio of 1:1 for the free DNA and the 2:1 species clearly shows the formation of a strong and highly cooperative stacked complex by DB293 with the –ATGA– sequence as also observed in SPR studies.

