Fig. 5.
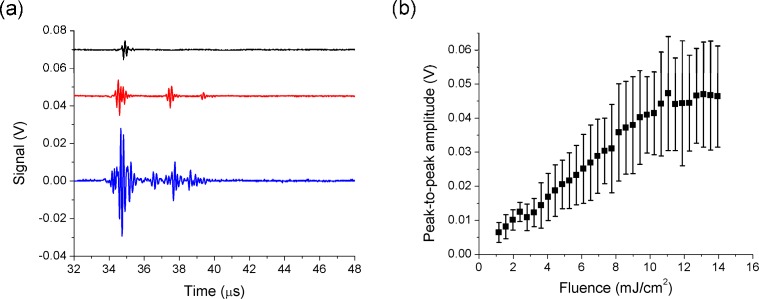
(a) Acoustic signals emitted from photoacoustic cavitation events around mixed gold nanorods (5.7 × 10⁸ nanoparticles/ml) at a peak negative pressure of 1.8 MPa and fluences of 1.3 mJ/cm2 (black line), 4.1 mJ/cm2 (red line), and 13.0 mJ/cm2 (blue line). (b) Peak-to-peak amplitude of the acoustic signals from photoacoustic cavitation events around gold nanorods (5.7 × 10⁸ nanoparticles/ml) as a function of laser fluence at a peak negative pressure of 1.8 MPa. Symbols and error bars are the mean values and standard deviations of the amplitude.

