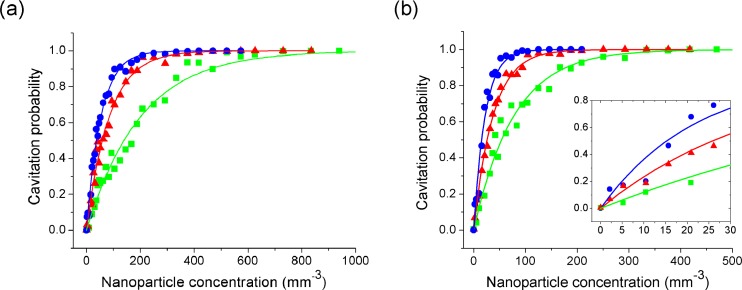
Fig. 6.
Cavitation probability as a function of nanoparticle concentration around gold nanospheres at peak negative pressures of (a) 2.0 MPa and (b) 3.0 MPa and fluences of (●) 7.6 mJ/cm2, (▲) 6.5 mJ/cm2 and (■) 5.4 mJ/cm2. Solid lines are fitted using Eq. (2). Inset of (b) is a zoom-in of the probability curves at 3.0 MPa.

