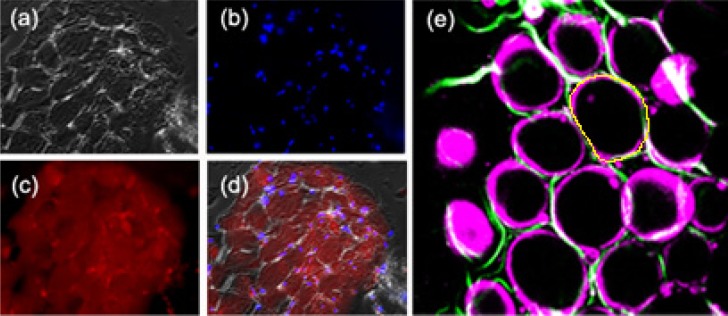
Fig. 1.
(a) Differential interference contrast, (b) DAPI staining, and (c) Oil Red O staining images of mediastinal adipose tissue from a patient undergoing cardiac surgery. (d) A superimposition image of (a)-(c). (e) Combined SHG (green) and THG (magenta) images of adipose tissues. The yellow contour represents the boundary of the adipocyte at its largest cross-section. Fields of view: (a)-(d) 445 × 344 µm. (e) 240 × 240 µm. Laser pixel dwell time in (e) was 320 ns.

