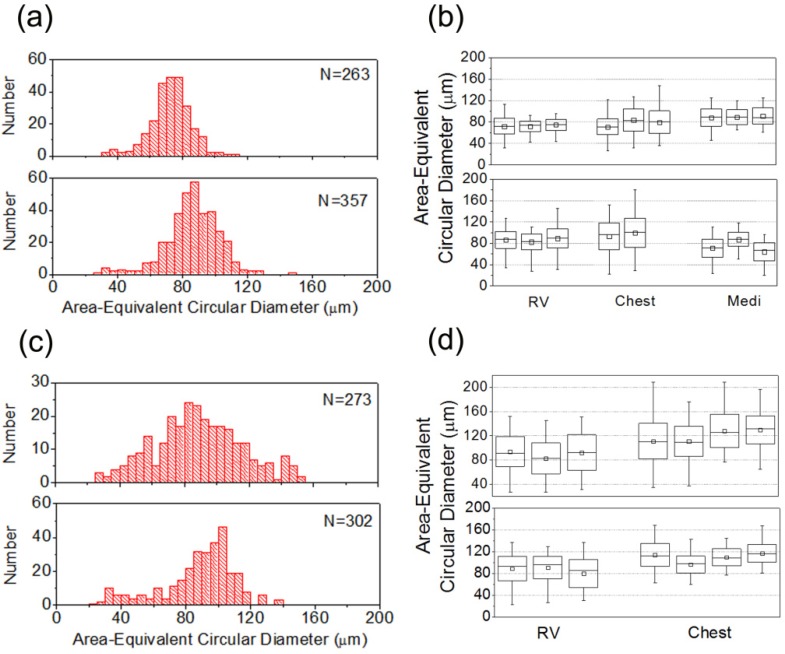
Fig. 4.
Histograms and statistics of the sizes (area-equivalent circular diameters) of adipocytes from (a), (b) two patients with no cardiovascular risk factors and (c), (d) three CAD patients. (a), (c) show size histograms of epicardial adipocytes obtained from the surface of right ventricle (RV) and N represents the number of adipocytes analyzed. Box charts (b), (d) illustrate the average (square), median (line in box), variance (box), and ranges of adipocyte sizes measured at different locations within a sample and at different fat tissues in a patient. Adipose tissues were obtained from the surface of right ventricle (RV), subcutaneous tissue of chest wall (Chest), and mediastinal fat (Medi).

