
Figure 1.
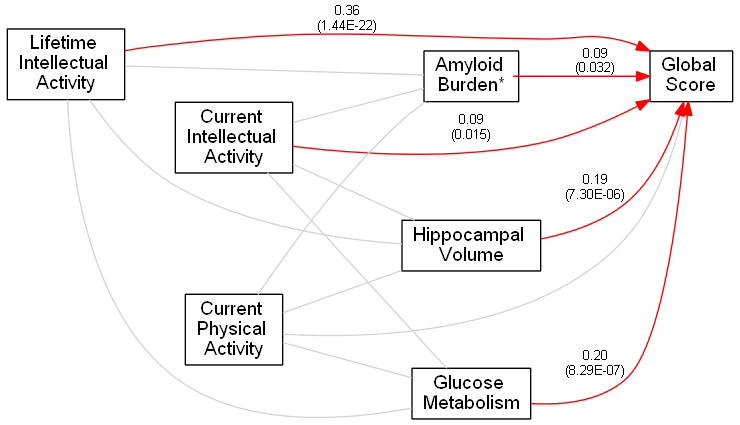
Results of the path analysis between the three sets of variables in the study – lifestyle activities, imaging biomarkers and global cognition. Gray lines indicate associations which were tested but found to be non-significant. Red lines indicate the significant direct effects observed in our data. Numbers beside the red lines are standardized betas (p-values). * Coded as -ln(Amyloid Burden).