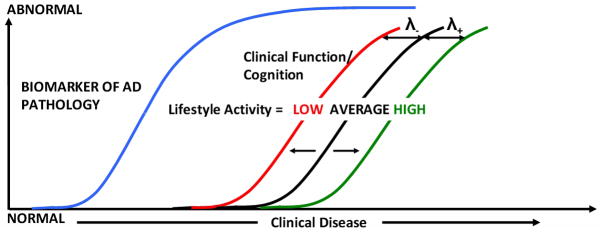
Figure 2.
Model illustrating the effect of lifestyle activities on AD biomarkers and cognition or clinical function in subjects. Clinical disease stage is indicated on the horizontal axis and the magnitude of biomarker abnormalities and cognition (from normal to maximally abnormal) on the vertical axis. The cognition or clinical function curve is moved left-right based on the individual’s lifestyle activity. The variable λ for lifetime intellectual activity is greater than that for current intellectual activity and the variable λ for physical activity is close to zero.

