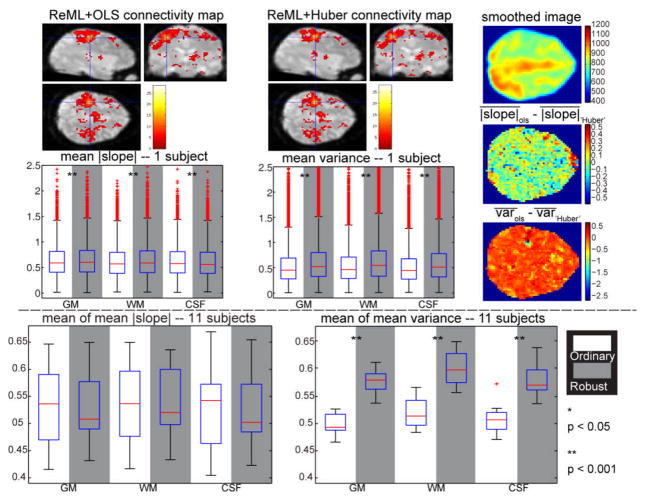
Fig. 3.
Resilience results for empirical 3T rs-fMRI analysis. The upper plots present results for a representative subject and the lower plots display the results across the 11 subjects. The first row shows the connectivity maps estimated by the OLS and Huber methods (p < 0.001, 5 voxels extent threshold to exclude noise). The blue crosshairs indicates one voxel inside the ROI. The right column displays one slice of the smoothed image from one scan (top) the difference of the mean absolute slope (middle), and the difference of the mean variance (bottom) for the same slice. The mean absolute slope and the mean variance from OLS (white background) and Huber (gray background) across GM, WM and CSF regions are shown in the second row. In the second half, the mean of the mean absolute slope and the mean of the mean variance across eleven subjects are displayed. Significant differences based on the Wilcoxon signed-rank test are indicated by the asterisks.

