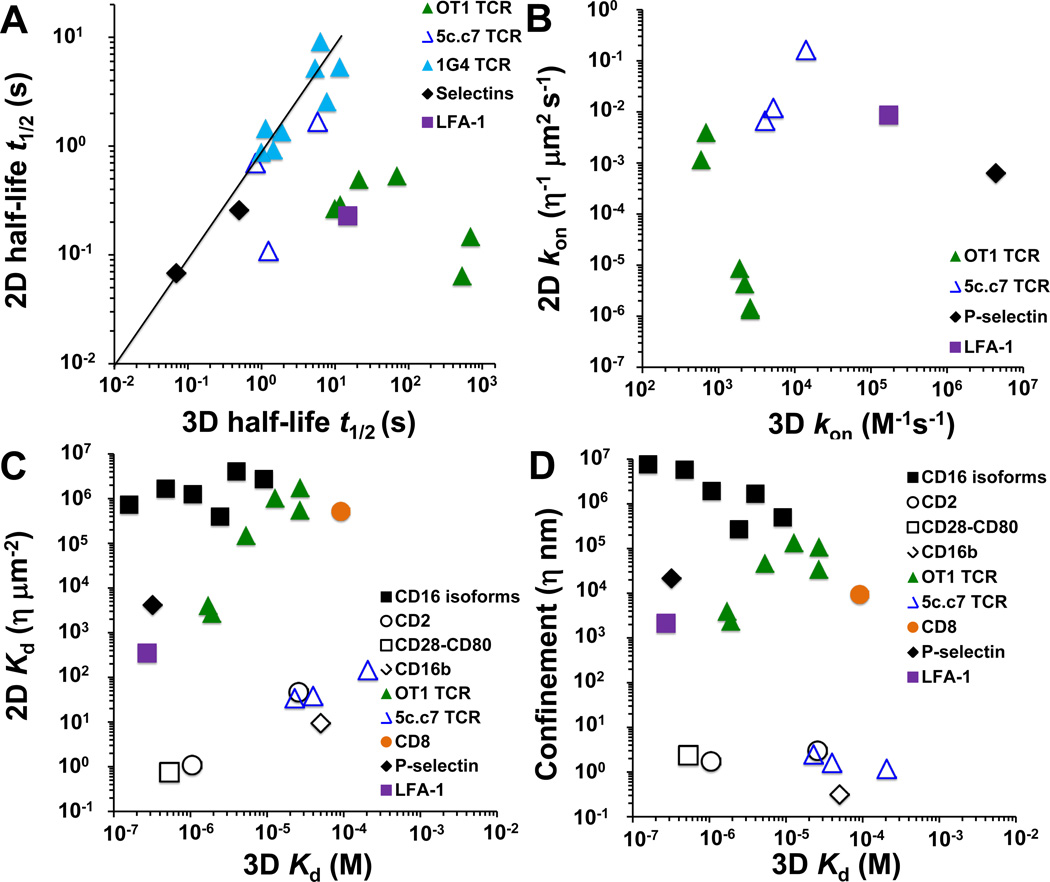
Fig. 2. Comparison of 2D and 3D binding parameters.
Half-life t1/2 (A), on-rate kon (B), equilibrium dissociation constant Kd (C), and confinement length (D) plots are shown for indicated molecular systems. 2D data obtained using living cells (unless otherwise stated) by the fluorescent and mechanical methods are shown with open and closed symbols, respectively. Data for TCR–pMHC interactions are shown as open or closed triangles. (A) 2D data for 1G4 TCR interacting with a panel of pMHCs ( ) (29) and PSGL-1 interacting with P- and L-selectin (♦) (33) were measured using cell-free systems by the flow chamber and BFP thermal fluctuation assays, respectively. (B) kon was calculated from the data in (A) and (C) by kon = 0.693/(Kd × t1/2). (C, D) Black symbols are from (46), including micropipette data for CD16 isoforms interacting with IgG of different species (■) (72), and Golan-Zhu plot data for CD2 interacting with CD58 and CD48 (○) (36), CD28–CD80 (□) (73), and CD16b-IgG (◊) (74) interactions.

