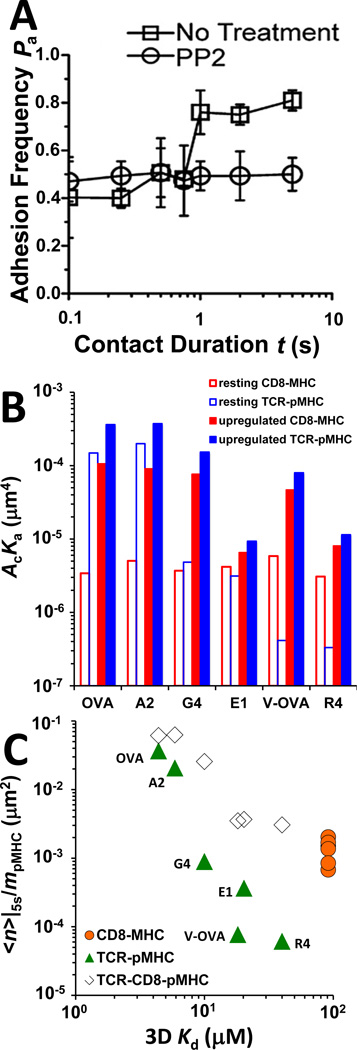
Fig. 3. Analysis of TCR–pMHC–CD8 trimolecular interactions.
(A) Two-stage adhesion frequency vs. contact time data of T cells from OT1 TCR transgenic mice interacting with OVA pMHC in the absence (□) and presence (○) of PP2. Reproduced from (23) with permission. (B) Bimolecular interaction affinities measured under conditions in which only bimolecular interactions were allowed (open bars, denoted by resting interactions) or calculated under the assumption that the increased adhesion in the second stage was due to upregulation of the chosen interaction with all other interactions unchanged (closed bars, denoted by upregulated interactions). (C) Plots of normalized bonds, defined as the average number of bonds <n> at 5-s contact time, calculated from adhesion frequency Pa by <n> = − ln(1 − Pa) and divided by the pMHC density, of TCR–pMHC ( ) and MHC–CD8 (
 ) bimolecular interactions and of TCR–pMHC–CD8 (◊) trimolecular interaction for the indicated peptides are plotted against 3D Kd.

