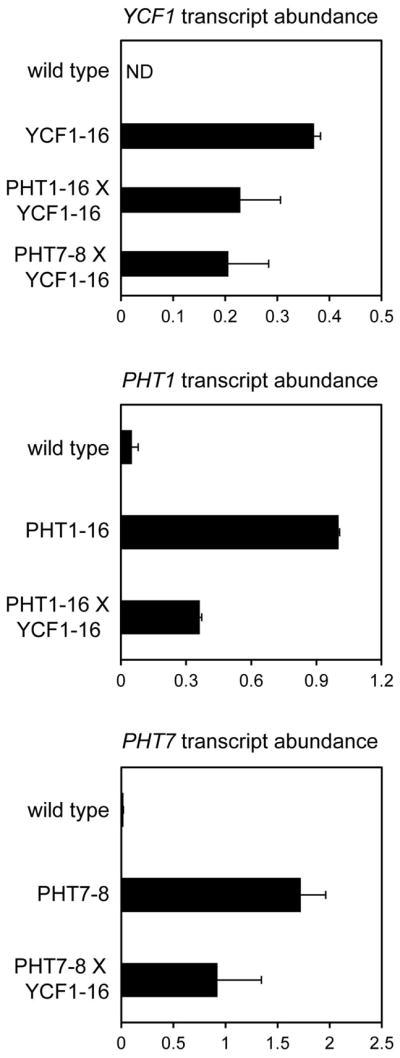
Fig. 3.

Confirmation of transgene overexpression in transgenic seedlings. YCF1, PHT1, and PHT7 transcript levels in whole seedlings of the genotypes indicated are presented relative to the transcript abundance of the ACTIN2 endogenous control gene for each corresponding genotype. Values are the means of four to six replicates, and error bars indicate standard deviation. ND, not detected.
