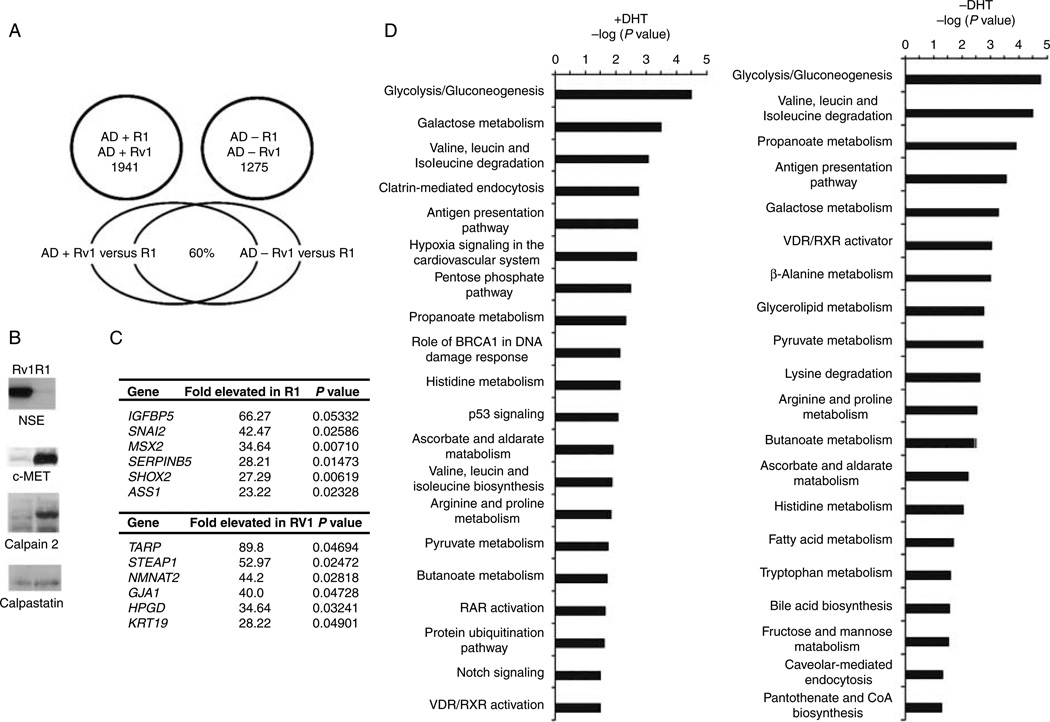
Figure 1.
Differences in gene expression of R1 and Rv1 cells in the presence and absence of a DHT. (A) Venn diagram of the number of genes differentially expressed in R1 and Rv1 cells in castrate levels of androgen and after a 2 h treatment with 10 nM DHT. The lower venn diagram shows the cohort of genes differentially expressed in the absence and presence of androgen. (B) Western blot analysis verification of several differentially expressed proteins that were identified by the expression array study. (C) The most differentially expressed transcripts in R1 and Rv1 cells treated with 10 nM DHT. (D) The IPA was used to identify the pathways that differed in the two cell lines in the presence and absence of androgen. The Fisher’s exact test was used to determine the probability that the association between the dataset and a given pathway is due to chance alone. The most significant pathway differences in the presence and absence of androgen involved metabolic pathways.

