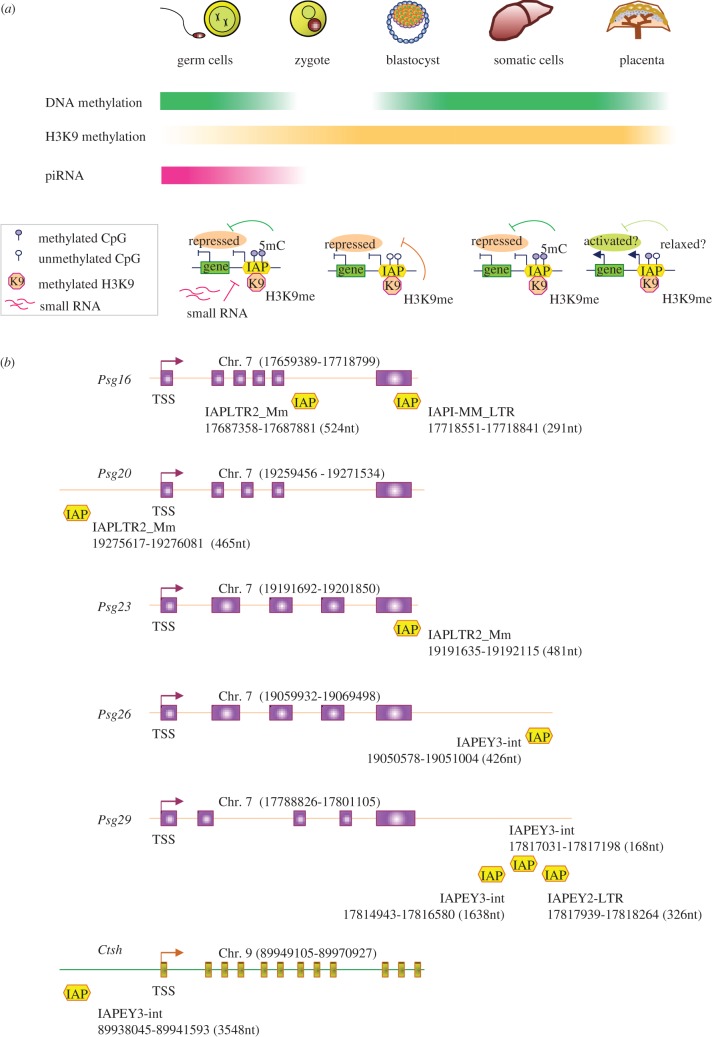
Figure 2.
Potential roles for IAPs in the placenta. (a) Tissue-specific regulation of the IAP elements is shown in a schematic figure (top panel). The DNA methylation level is higher in the germ and somatic cells (deep green, top bar) but is erased in the early embryo (colourless). The global level of DNA methylation in the placenta (light green) is lower than the somatic and germ cells. H3K9 methylation levels are demonstrated in orange (middle bar). The small RNA pathway represses IAPs in the germ cells (dark pink, bottom bar) but presumably not in the early embryo or somatic cells (colourless). The bottom panel delineates a putative model which shows how activation (or repression) of an IAP element can influence the transcriptional level of a nearby gene. IAP elements are repressed by silencing mechanisms such as DNA methylation (5mC), histone H3K9 methylation (K9) and small RNAs, which also blocks the activation of the nearby gene. Releasing the constraint on the IAP element (i.e. partial demethylation) causes derepression of both the IAP and the nearby gene. (b) Schematic illustrating the approximate positions of the IAP sequences within or near placenta-specific genes. The pregnancy-specific glycoprotein (Psg) genes (Psg16, Psg20, Psg23, Psg26, Psg29) and cathepsin H (Ctsh) are shown. Transcription start site (TSS) for each gene is shown with an arrow. The chromosome number and the start/end of the gene loci are given at the top of each figure. IAP insertions are denoted with yellow boxes and the type, start/end, length of each individual IAP sequence are exhibited beside a box.

