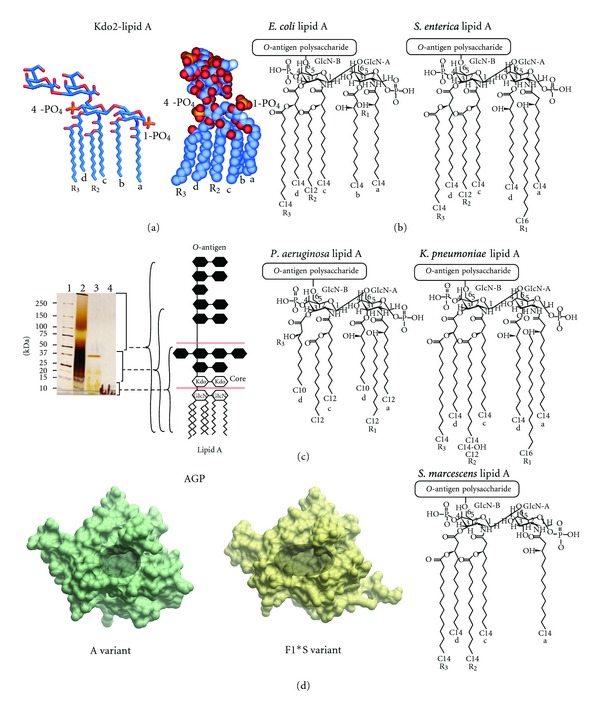
Figure 1.

(a) Structure of Kdo2-lipid A shown in stick (left-hand panel) and CPK (right-hand panel) representation. (b) Chemical structures of the lipid A component of the LPS samples used in this study [41–43]. (c) 4–20% SDS-PAGE separation of the LPS samples used in this study. The well samples contained 30 μg of each LPS sample. The gel was stained by the silver staining technique used for LPS [44]. The structural organization of LPS is shown schematically in the right-hand panel. Lane 1: molecular weight; Lane 2: E. coli O111:B4 LPS; Lane 3: E. coli EH100 (Ra) LPS: Lane 4. E. coli F583 (Rd) LPS. (d) Surface representation of the A (PDB ID: 3APU) and F1*S (PDB ID: 3KQ0) variants of human AGP. The ligand binding pocket of each variant is highlighted by the shaded area.
