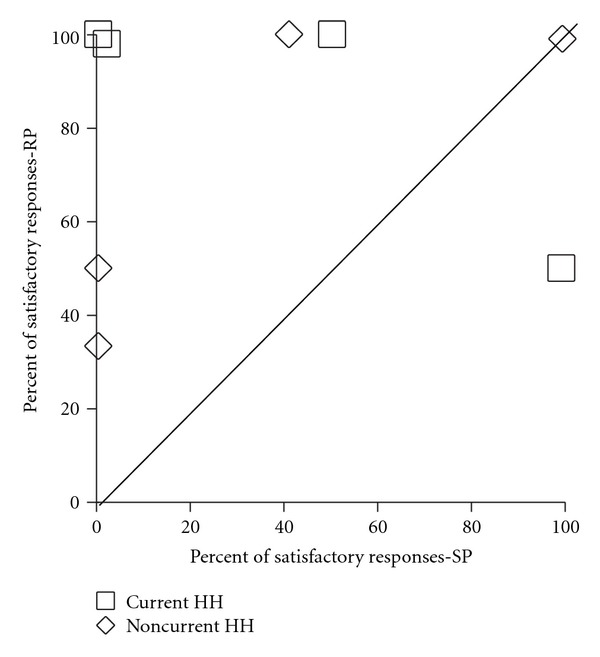
Figure 5.

Percent of satisfactory responses to unexpected hazardous events on the blind side in the sham prism (SP) and real prism (RP) drives for the eight participants with blindside events in both drives. The diagonal line represents identical performance in the two drives. Six drivers (three current and three noncurrent) had a higher proportion of satisfactory responses in the RP than the SP drive (data points above the diagonal; P = 0.03).
