
Figure 5. Changes in Imaging Related Expenditures, 2000 to 2007.
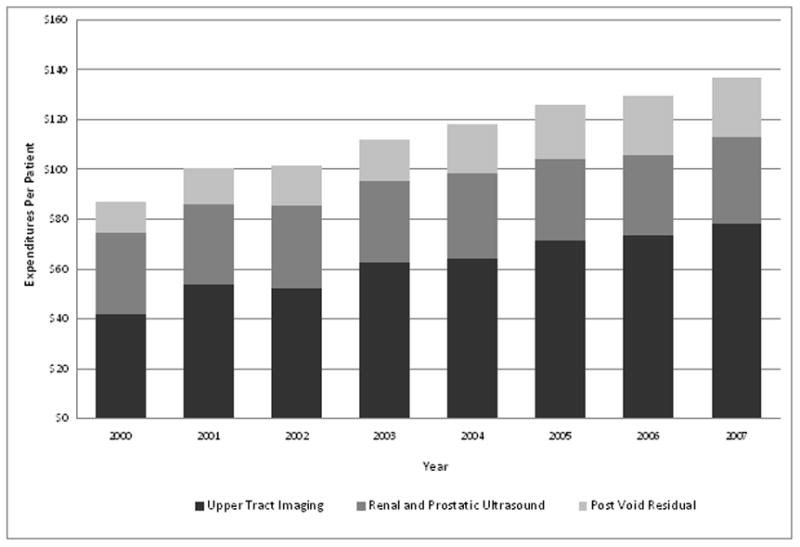
Expenditures increased significantly for post void residual (p<0.0001) and upper tract imaging (p<0.0001). Upper tract imaging had the most significant rate of growth.
Official websites use .gov
A
.gov website belongs to an official
government organization in the United States.
Secure .gov websites use HTTPS
A lock (
) or https:// means you've safely
connected to the .gov website. Share sensitive
information only on official, secure websites.
Expenditures increased significantly for post void residual (p<0.0001) and upper tract imaging (p<0.0001). Upper tract imaging had the most significant rate of growth.