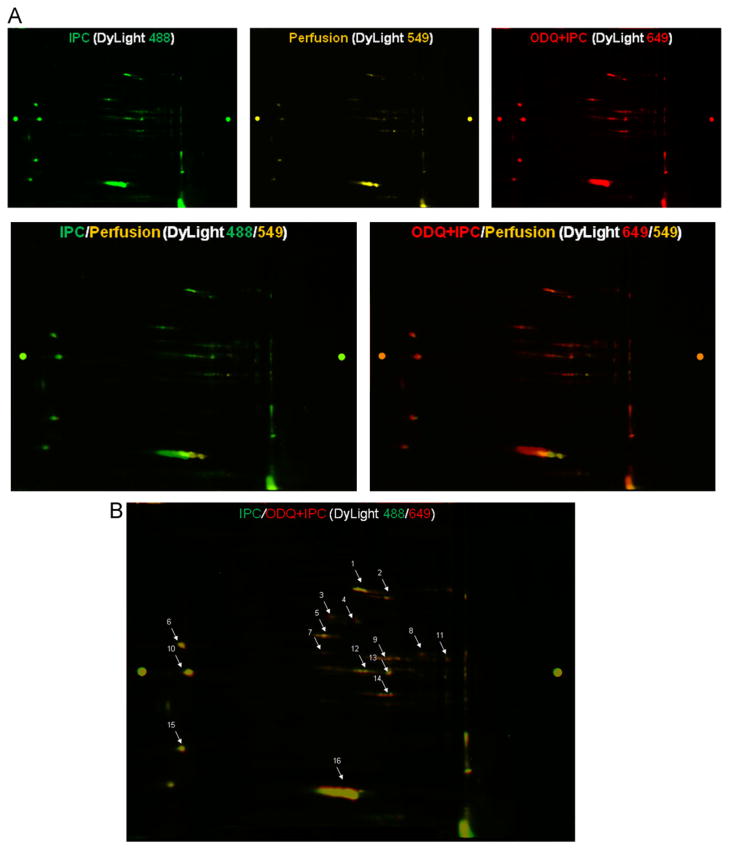
Fig. 3.
Differences in protein S-nitros(yl)ation in total heart homogenate isolated from perfusion control and IPC hearts with and without ODQ treatment. (A) Top panels: a representative 2D DyLight DIGE gel was scanned at each of the distinct wavelengths of the DyLight fluors, showing a pattern of protein SNO for that particular treatment group. Bottom left panel: overlaid images of DyLight 488 (IPC, green) vs 549 (Perfusion, yellow). Bottom right panel: overlaid images of DyLight 649 (ODQ+IPC, red) vs 549 (Perfusion, yellow). (B) The overlaid images of DyLight 649 (ODQ+IPC, red) vs 488 (IPC, green) showed that there was still an increase of S-nitros(yl)ation for some proteins in ODQ+IPC vs IPC hearts. The protein spots were picked for MS/MS analysis, and are listed in Table 2.

