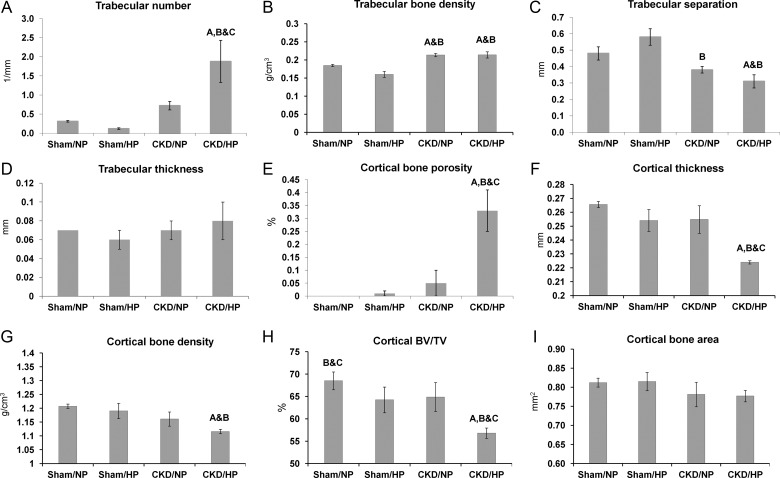
Fig. 3.
Femur morphometrics based on micro-CT analysis. (A) Trabecular number (per mm), (B) trabecular bone density (g/cm3), (C) trabecular separation (mm), (D) trabecular thickness (mm), (E) cortical porosity (%), and (F) cortical thickness (mm), (G) ortical bone density (g/cm3), (H) Cortical BV/TV, %. (I) Cortical cross-sectional area (mm2). Bars represent mean ± SEM. Letters above the graph denote significance (P< 0.05), A compared with the sham/NP group; B compared with the sham/HP group; C compared with the CKD/NP group. Sham/NP n= 5; sham/HP n= 5; CKD/NP n= 6; CKD/HP n= 4.

