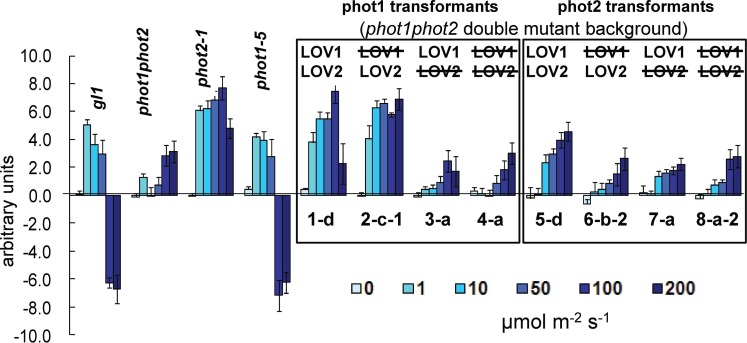
Fig. 1.
Chloroplast movement phenotypes in wild-type (gl1), phot single mutants (phot1-5 and phot2-1), the untransformed double mutant (phot1-5 phot2-1) and representative double mutant phot1-5 phot2-1 seedlings transformed with PHOT expression constructs. Leaves were treated for 30 min at the indicated fluence rates of blue light. Images of the chloroplast movement; a comparison of the darkness of the illuminated strip with that of the covered areas was analyzed by Image J software. Error bars are the SEM. n = 12. The experiment was carried out three times with similar results.

