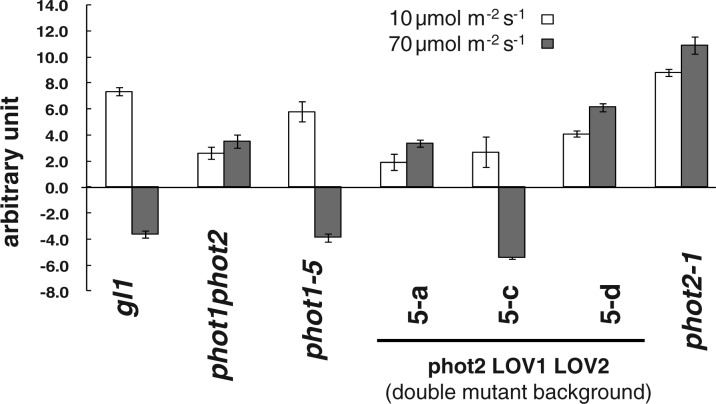
Fig. 3.
Quantitative representation of chloroplast movements in the seven lines shown in Fig. 2 in response to blue light. The two fluence rates were chosen so that the lower one induced an accumulation response and the higher one induced an avoidance response in wild-type (gl1) leaves. Of the three transformant lines, only line 5-c shows an avoidance response. Error bars are the SEM. n = 12. The experiment was carried out three times with similar results.

