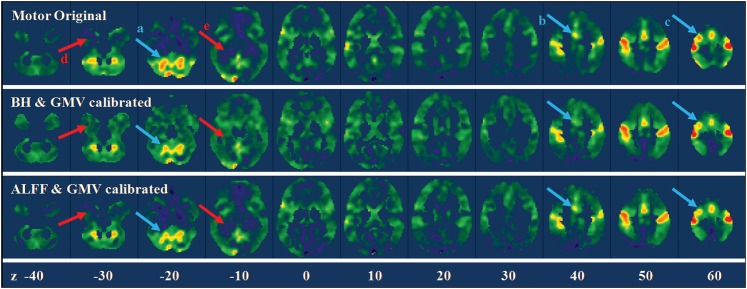
Figure 6.
Whole-brain motor task activation maps for a single subject before and after calibrations. The upper panel showed the original beta maps of the motor activations, and the middle and lower panels showed the beta maps after BH/GMV and ALFF/GMV calibrations. The arrows highlighted the regions with obvious suppression (light blue) and enhancement (light red) after calibrations. Z values in the bottom represented the z coordinates in the MNI space.

