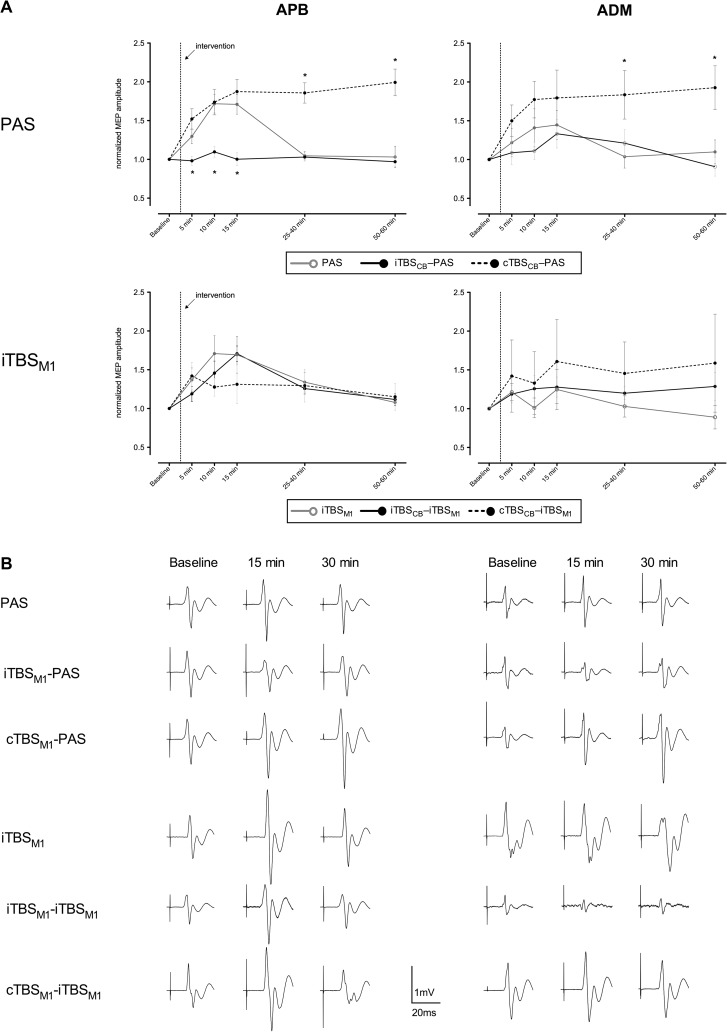
Figure 2.
Mean MEPs after each intervention: (A) The “PAS” panels show the effects of PAS and of the cerebellar priming on PAS in the same group of subjects. The iTBSM1 panels show the effects of iTBSM1 alone and of the cerebellar priming on iTBSM1 in the same group of subjects, except for the cTBSM1 → iTBSM1 protocol that was performed as a control experiment on a separate set of subjects (analyzed separately vs. their own iTBSM1 session). The MEPs were averaged at several time points before and after each plasticity inducing protocol, then normalized to the prestimulation mean values. Data are presented as means ± standard error. (*) indicates normalized mean MEP amplitudes significantly different from the values obtained after PAS alone (in the “PAS” panels) and after iTBSM1 alone (in the “iTBSM1” panels) at corresponding time points. (B) Examples of nonnormalized mean MEPs from the same subject (except the cTBSCB → iTBSM1 session) representative for each session.

