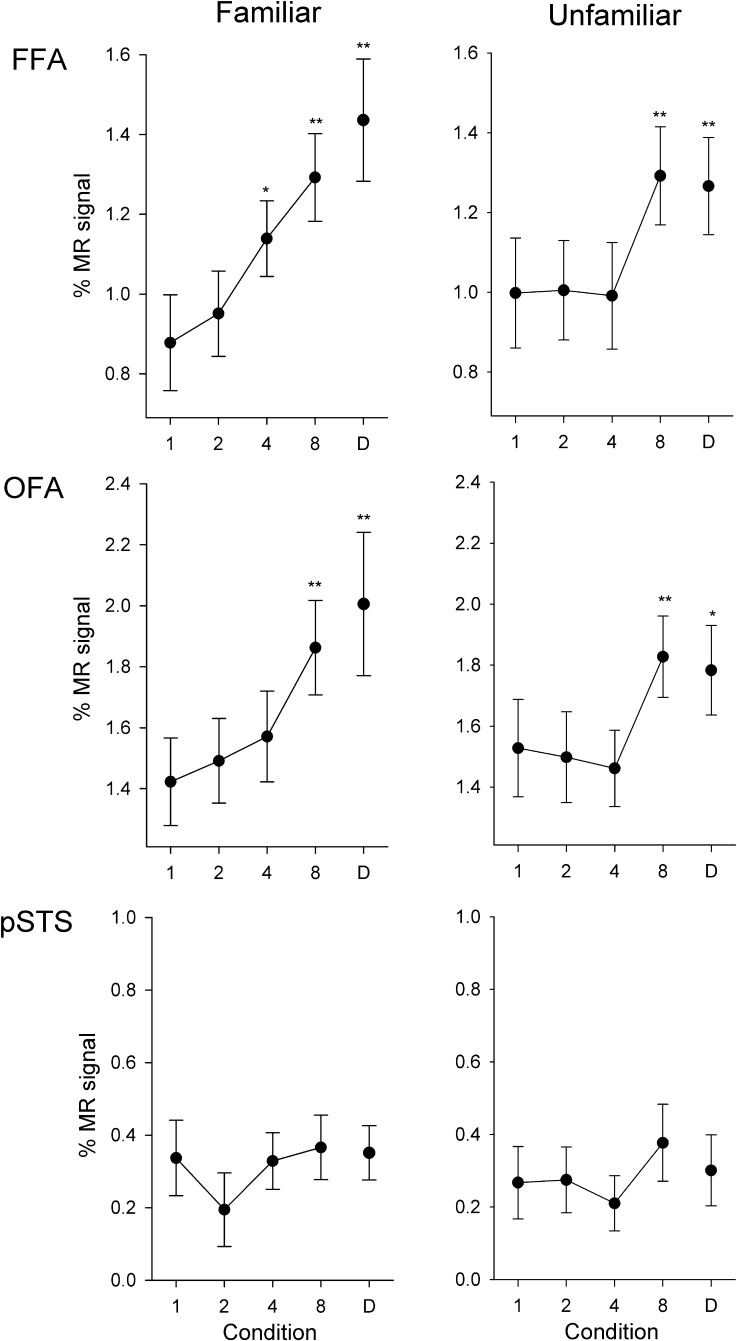
Figure 5.
Experiment 2: Responses of face-selective regions to different images of the same identity. Peak responses to the different conditions are shown in the FFA, OFA, and pSTS, for familiar and unfamiliar faces. There was a gradual increase in response in the FFA and OFA with increases in the number of different images shown in a stimulus block for both familiar and unfamiliar faces. However, there was no difference between any of the conditions in the pSTS. Error bars represent ±standard error across all participants. *P < 0.05, **P < 0.01, indicates an increased response relative to the 1-image condition.

