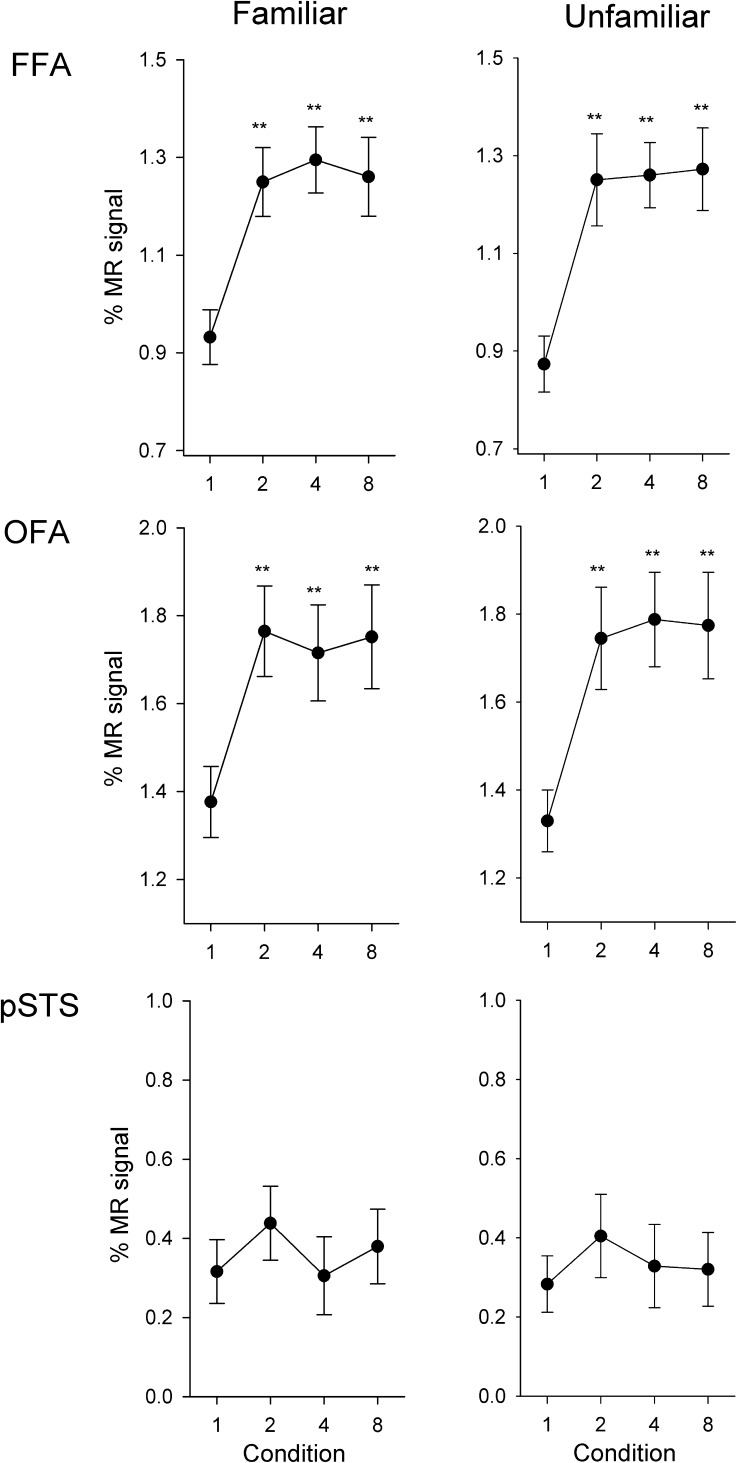
Figure 6.
Experiment 3: Responses of face-selective regions to different images of different identities. Peak responses to the different conditions are shown in the FFA, OFA, and pSTS. In contrast to Experiment 2, there was an immediate increase in response in the FFA and OFA when different images were shown in a block for both familiar and unfamiliar faces. However, there was no difference between any of the conditions in the pSTS. Error bars represent ±standard error across all participants. *P < 0.05, **P < 0.01, indicates an increased response relative to the 1-image condition.

