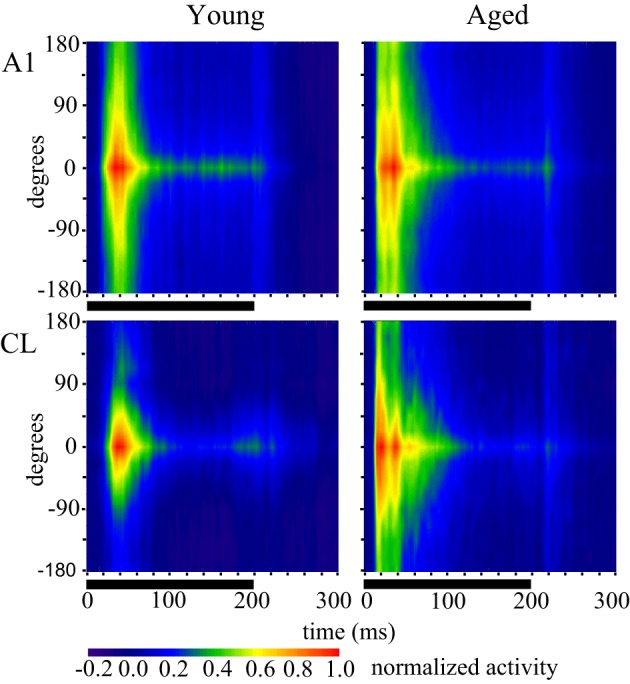
Figure 2.

Population response across time and spatial location. Each panel shows the response of the population of A1 (top) and CL (bottom) neurons in young animals (left) and aged animals (right). Warmer colors represent greater activity. The response period is shown as the solid line below each panel. Each neuron was normalized to the best direction at 0 along the y-axis, with leftward eccentricities below and rightward eccentricities above. Young animals showed an increase in spatial tuning between A1 and CL, as shown by less activity beyond about ± 90°. There was also more of a sustained response for the best direction compared to eccentric directions. Aged animals showed broader tuning in general, particularly in area CL, and a more oscillating response over time.
