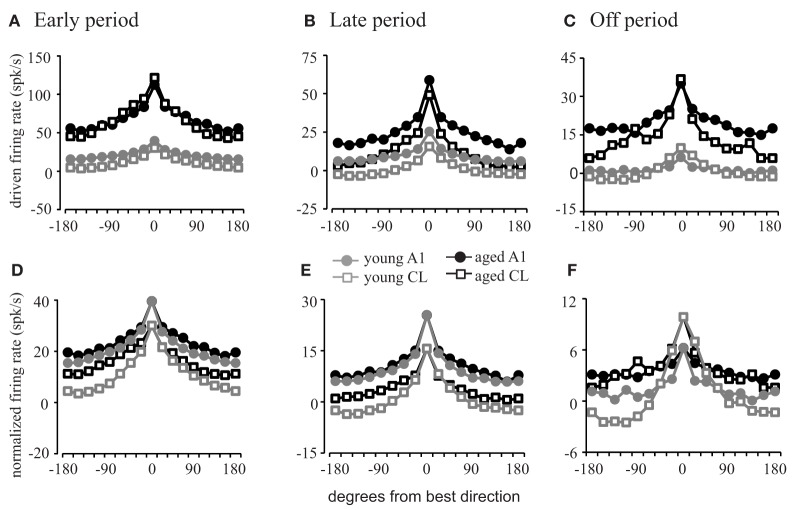
Figure 4.
Firing rates as a function of stimulus location. Population firing rate curves relative to the best direction of each cell. (A–C) Show the absolute firing rate; (D–F) show rates normalized to the best direction of the young animals. Response profiles in the early (A,D), late (B,E), and off (C,F) periods are shown. Aged animals have a much greater driven firing rate than young animals (A–C). The difference in the shape of the tuning functions is minimal for A1 neurons (circles) except in the off period. However, the tuning functions are much sharper in young CL compared to aged CL (squares) across all three response periods. See Table 2 for SEMs.

