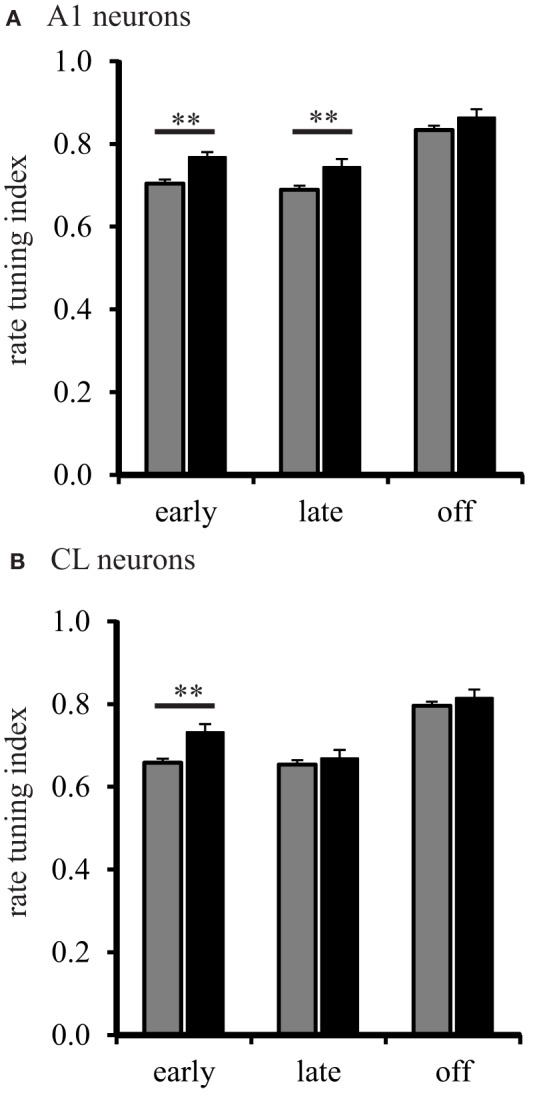
Figure 5.

Population spatial tuning index during different response periods. Panel (A) shows the RTI during the early, late, and off periods in A1 of young (gray) and aged (black) monkeys. There were differences found except during the off period. Panel (B) shows the results from CL neurons. Here, aged monkeys were more broadly spatial tuned during the early period (**p < 0.01).
