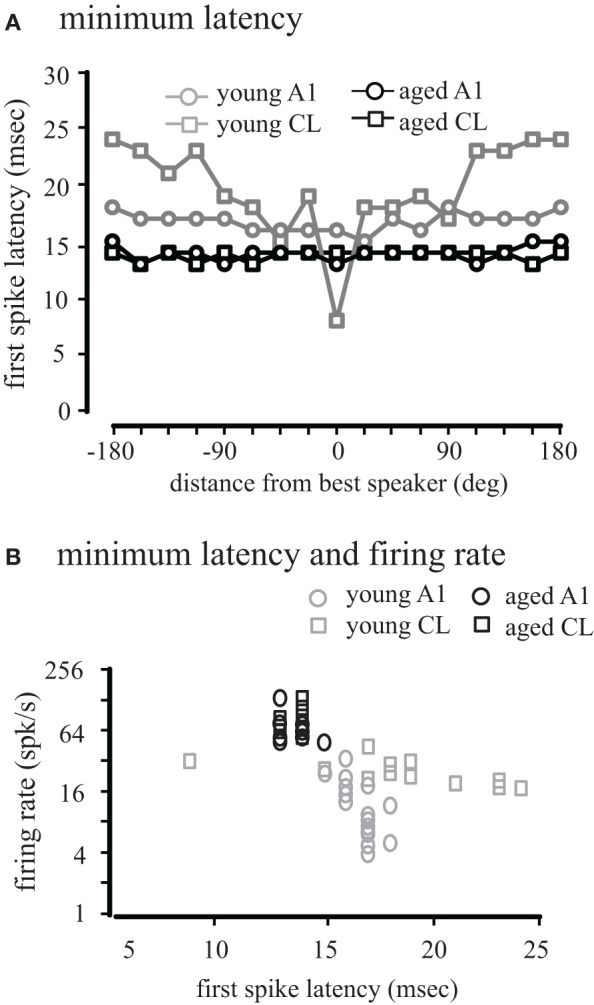
Figure 8.

Population first-spike latency. The first-spike latency at each location relative to the best direction is shown for young (gray) and aged (black) monkeys in A1 (circles) and CL (squares) in Panel (A). Aged monkeys had consistently shorter first-spike latencies than young animals. There was also no difference between A1 and CL in aged monkeys, but in young animals latency increased with distance from the best location. (B) Shows the regression between minimum latency and firing rate. There was a significant increase in latency with a decrease in firing rate in younger animals, but this correlation did not exist in aged animals.
